

- Crypto market cycles are recurring price and volume patterns that occur over a set period
- Four-year market cycles are often influenced by Bitcoin's halving event, which decreases the amount of BTC rewards for miners
- Institutional capital and Bitcoin getting absorbed by TradFi could cancel the previous four-year cycles
Crypto market cycles are price patterns in the cryptocurrency market that show fluctuations over time. While they might seem chaotic, they are linked to macroeconomic shifts and potential changes in the money supply and investor interest. Let's explore how market cycles work and how they are defined.
What Are Market Cycles in Crypto?
Crypto market cycles are patterns that occur over a set time frame, during which a token's price exhibits similar behavior. In crypto, market cycles are identical to those in other financial markets, but are more prone to volatility spikes during the cycle. These cycles are often referred to as bear or bull market cycles, in which prices decline, find support, then rise to new highs or return to a range.
Investor psychology, macroeconomic events, and trader behavior drive market cycles. Now, in crypto, these market cycles are triggered by fear, enthusiasm, and panic selling. As more liquidity has entered crypto markets, cycles have started to adjust to new realities.
What Stage Is the Crypto Market Cycle in Now?
In July 2026, the market assessment is that crypto is currently in a late-stage bear market and bottom-building phase. On-chain data shows early signs of accumulation without concrete confirmation of a new bull market. In July, Bitcoin recovered from June, which saw prices in the $60,000 range after dropping 20.5%. Selling pressure is easing, and institutional flows have improved.
US Bitcoin Spot ETFs recorded seven consecutive days of net inflows, with average purchase rates of $1 billion. Even with the current improvements, the broader market remains risk-off as Bitcoin has not yet cleared the main cost-basis resistance above it.
This is best understood as a transition zone rather than a confirmed phase change.
| Cycle signal | Current interpretation |
|---|---|
| Bitcoin price structure | Recovering from the June lows but testing major resistance |
| Long-term-holder activity | Capitulation is cooling, suggesting selling pressure may be approaching exhaustion |
| On-chain accumulation | Concentrated among larger holders |
| ETF flows | Turned positive |
| Overall regime | Repairing, but still risk-off |
Despite these improvements, several conditions remain unresolved. Bitcoin is still confronting the cost basis of recent buyers, where holders who have been underwater may choose to sell once they return to break-even.
Accumulation is also narrow. Recent buying has been concentrated among wallets holding between 1,000 and 10,000 BTC, while several smaller and mid-sized groups of holders have not shown the same conviction. A durable recovery would normally be more convincing if accumulation broadened across multiple investor groups.
What would confirm the next cycle phase?
For the crypto market to recover, there’s a need for a stronger upward trend that requires multiple indicators to improve.
- Bitcoin reclaiming and holding the $69,000 price, which indicated the short-term holder average cost
- Persistent spot Bitcoin ETF inflows
- Sustained net outflows of Bitcoin from exchanges
- Broader accumulation across different wallet sizes
- Continued decline in long-term-holder loss realization
- Rising spot-market volume rather than a rally driven mainly by derivatives
A rejection from resistance, renewed exchange inflows, or another increase in long-term-holder capitulation would weaken the recovery case. Losing the demand area around $63,000 would also place greater pressure on the developing market base.
Market-cycle classifications are retrospective and probabilistic. No single price level or indicator can confirm the exact phase in real time. This assessment should therefore be updated regularly as price structure, ETF flows, holder behavior, liquidity, and macroeconomic conditions change.
How Crypto Market Cycles Differ from Economic Cycles
Crypto cycles differ from economic cycles because, in crypto, there’s a distinct dynamic from traditional markets. In monetary cycles, the pattern refers to fluctuations in markets influenced by economic growth or contraction. These cycles can last years or decades in some cases.
In crypto, however, these cycles are influenced by investor behavior, which responds to external factors such as policy shifts, macroeconomic events, and even economy-related news. Crypto cycles have a preset pattern: Bitcoin bulls drive the price for approximately 4 years, followed by a shorter bear market of approximately 2 years or less.
While a strong economy with low interest rates can create a favorable environment for riskier assets like crypto, the crypto market often moves to its own rhythm.
Crypto Market Cycle Phases
A typical crypto market cycle comprises four distinct phases. Recognizing the characteristics of each phase can help investors identify opportunities and manage risk more effectively.
Phase 1: Accumulation
The accumulation phase follows a major market crash and is characterized by low prices and thin trading volumes. During this time, public interest drifts away, media coverage is neutral to negative, and institutions are taking exposure in the market. While the market may appear flat, this period of stability lays the groundwork for the next bull run.
Phase 2: Uptrend (Bull Market)
The second phase is a bull market or an uptrend, in which market sentiment shifts from pessimism to optimism as prices begin to rise. Retail is returning to crypto, driven by positive news, technological advancements, and growing adoption, fueling the rally. In crypto, this phase is often characterized by parabolic price increases. Bitcoin typically leads the charge, followed by a rotation of capital into altcoins.
Phase 3: Distribution
In the distribution phase, early investors start taking profits, selling their holdings to newcomers who've entered a euphoric stage. Volatility increases, with sharp price drops followed by quick recoveries, creating uncertainty. Many new investors see this as a consolidation, when in fact it's a sign of a market top.
Phase 4: Downtrend (Bear Market)
The downtrend, or bear market, is triggered when selling pressure overwhelms buying pressure. Prices begin to fall, and the decline accelerates as panic sets in. Investors who bought near the top are forced to sell at a loss, creating a cascade effect. The market sentiment shifts from denial to fear, and eventually to capitulation and despair.
The role of Bitcoin in market cycles
As the primary driver of the crypto market, Bitcoin's price movements significantly influence altcoins. This influence stems from its first-mover advantage, making it the most well-known and widely held digital asset. Furthermore, Bitcoin's market dominance—its large share of the total crypto market capitalization—is crucial, as many altcoins are priced and traded against it.
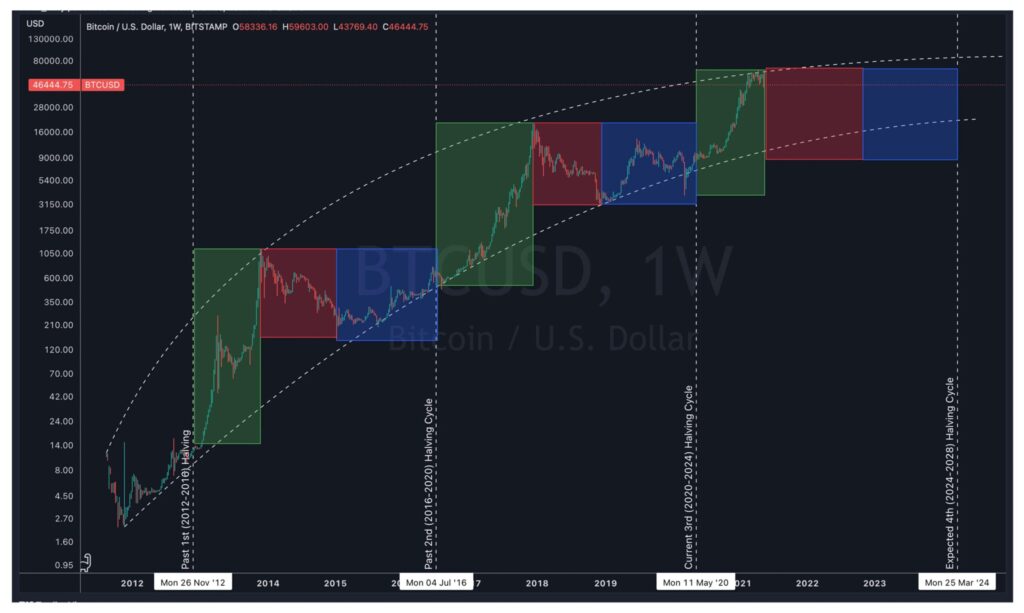
Cycles of Bitcoin
Bitcoin is characterized by four-year cycles, during which the asset price fluctuates from all-time highs to support levels. The cycles have been catalyzed by Bitcoin halvings, which reduce the number of new Bitcoins that are issued.
2012–2015 Cycle: The first halving in November 2012 was followed by a massive bull run in 2013, with Bitcoin's price soaring to over $1,000. A prolonged bear market followed this in 2014 and 2015.
2016–2019 Cycle: After the second halving in July 2016, Bitcoin embarked on its famous 2017 bull run, reaching nearly $20,000. The "crypto winter" of 2018 followed, with prices crashing over 80%.
2020–2023 Cycle: The third halving in May 2020 preceded the 2020-2021 bull market, which saw Bitcoin hit an all-time high of around $69,000 in November 2021. A significant downturn followed this in 2022.
The Role of Halving in Market Cycles
Bitcoin halving is a pre-programmed event that occurs every 4 years, reducing miners' block rewards by 50%. The mechanism is meant to reduce asset inflation by shortening the time required to produce the same amount of BTC. In short, this reduced the supply of new Bitcoin.
Each halving has been a catalyst for the subsequent bull market. By creating a supply shock, the halving often leads to a price increase, assuming demand remains stable or grows. This predictable event has become a focal point for market psychology.
How to identify market cycles
Identifying the current phase of a market cycle is more of an art than a science, but several indicators can help:
Technical Analysis: Tools such as moving averages (e.g., the 200-day moving average), trading volume, and momentum indicators (e.g., the RSI) can help identify trends.
Market Sentiment: Gauging the market's general mood is crucial. Tools like the Crypto Fear & Greed Index can provide a snapshot of sentiment, with extreme fear often correlating with market bottoms and extreme greed signaling market tops.
On-Chain Analysis: Examining blockchain data can provide insights into the behavior of different investor cohorts.
Macroeconomic Factors: Keep an eye on the broader economic landscape. Factors such as interest rates, inflation, and geopolitical events can influence investor risk appetite and the crypto market.
Which On-Chain Metrics Help Identify Bitcoin’s Market-Cycle Stage?
On-chain metrics use Bitcoin blockchain activity to examine investor cost bases, realized profits and losses, accumulation, distribution, and the movement of coins between different holder groups. Unlike price indicators, they provide information about what market participants are doing with their Bitcoin.
No single metric can identify a market-cycle phase with certainty. A stronger assessment combines several indicators and checks whether they point toward the same conclusion.
| On-chain metric | What it measures | Cycle interpretation | Limitation |
|---|---|---|---|
| MVRV ratio | Market value compared with realized value | Low readings can accompany capitulation; elevated readings indicate increasing unrealized profit | Historical thresholds may change as the market matures |
| Realized price | Average on-chain cost basis of the Bitcoin supply | Trading below it has historically reflected market stress; holding above it suggests profitability | Not every transfer represents a market purchase |
| SOPR | Whether moved coins realize an average profit or loss | Above 1 shows realied profits and below shows realized losses | Short-term movements can create noisy readings |
| Short-term-holder cost basis | Average acquisition prices | Acts as support in uptrends and resistance during bearish recoveries | Classifications are statistical |
| Long-term-holder supply | Bitcoin held by older investor cohorts | Rising supply can suggest holding | Coins can move between custody rather than being sold |
| Exchange net position change | Change in Bitcoin held by labeled exchange wallets | Sustained inflows may increase potential selling supply; outflows may suggest accumulation | Exchange transfers don’t guarantee sales take place |
MVRV ratio
The Market Value to Realized Value ratio compares Bitcoin’s market capitalization with its realized capitalization, which values each coin according to the price when it last moved.
An MVRV reading above 1 means the market value of the Bitcoin supply exceeds its aggregate realized cost basis. A reading below 1 indicates that a significant portion of the market is holding Bitcoin below its on-chain acquisition value.
Realized price
Realized price estimates the average acquisition value of the Bitcoin supply based on the price at which each coin last moved. Comparing the current market price with realized price can show whether the market as a whole is holding an unrealized profit or loss.
SOPR
The Spent Output Profit Ratio measures whether coins moved on-chain were transferred at a profit or loss relative to the price at which they were acquired.
- SOPR above 1: Coins moved during the period realized an average profit.
- SOPR below 1: Coins moved at an average loss.
- SOPR near 1: Coins moved near their break-even value.
Long-term-holder behavior
Long-term-holder metrics examine coins that have remained unmoved for an extended period. Glassnode commonly uses a threshold of approximately 155 days to distinguish long-term holders from short-term holders.
An increasing long-term holder supply can suggest that more Bitcoin is maturing in less active hands. A sharp decline may indicate older investors are moving or distributing their assets.
Exchange balances and net flows
Exchange flows estimate how much Bitcoin is moving into or out of labeled exchange wallets.
Sustained exchange inflows can indicate that more Bitcoin is available for sale. Sustained outflows may indicate self-custody, long-term holding, or reduced immediate sell-side liquidity.
However, an exchange deposit is not necessarily a sale. Investors may transfer Bitcoin for collateral, internal account management, or other trading activities.
Why four-year market cycles are changing
While the four-year cycle anchored by the Bitcoin halving has been a reliable model for predicting Bitcoin price cycles, including the Stock-to-Flow model, dynamics are changing. Increased regulations, more institutional liquidity, and a maturing market are shifting how investors see Bitcoin's price action.
There is a stronger correlation between the global M2 money supply and Bitcoin price movements. Some argue that the four-year cycle following recent cryptocurrency policy changes will prolong cycles. According to research, the global money supply has increased from $50 trillion to $100 trillion, while Bitcoin's price has grown by 700x.
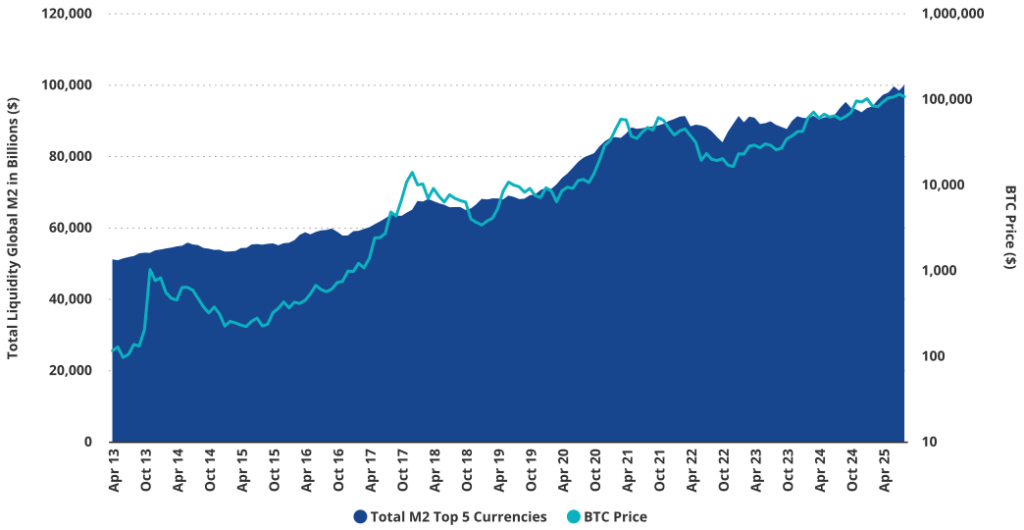
As Bitcoin and other digital assets become more integrated into ETFs and traditional finance, they tend to behave differently, driven by greater liquidity and a maturing market. This leads to lower volatility and fewer price spikes than in previous periods.
Finally, the crypto ecosystem is no longer solely dependent on Bitcoin. The growth of robust sectors like DeFi, NFTs, and Layer-2 solutions means that other narratives and technological developments can also drive market cycles, potentially decoupling them from Bitcoin's four-year rhythm.
Charting Bitcoin's course
Although crypto market cycles are evolving, with longer durations and less volatility, the market remains erratic. Investors must understand the signs of a potential cycle reversal or rally.
For those who want to navigate crypto markets without worrying about cycles and volatility, Yieldfund offers plans for every investor type. With three investment plans, investors can access 48% yearly returns.
FAQs
How long are market cycles in crypto?
Crypto market cycles have lasted approximately four years, aligning closely with the Bitcoin halving schedule. However, within these larger cycles, there can be smaller, mini-cycles that last several months.
Do altcoins have different market cycles?
No, since altcoins follow Bitcoin's lead, when Bitcoin enters a bull market, capital will flow into altcoins, causing them to rally. There is, however, a delay in altcoin cycles compared to Bitcoin's.
What are crypto seasons?
"Crypto seasons" refer to periods when a specific sector of the crypto market experiences significant growth and attention. The most well-known is alt season, a period when many altcoins outperform Bitcoin.
About the authors

Written by
Vlad Hategan
SEO content writer
Writes the articles in the Yieldfund knowledge base.
Dutch, English, Romanian

Translated by
Patricia Van den Kerckhove
Senior content translator
Translates and reviews Yieldfund's content in Dutch.
Dutch (NL & BE), French, English