

The S&P 500 is a point of reference for many investors. Even with the ongoing global crisis, the index has outperformed, pushing investors to question what's driving the Index's performance. In 2025, the top 10 S&P 500 companies account for roughly 41% of the entire index, more than doubling from the 18–23% range that held steady between 1990 and 2015.
When investors are doubting the S&P's performance, they need to understand that the growth is driven by a small group of mega-caps. It's no longer a balanced reflection of corporate America, but rather on a concentrated few.
Why the S&P 500 can rise while many stocks struggle
The S&P 500 is seen as a snapshot of the total US stock market, but in 2026, the assumption is far from being true. Over the past two years, the index has kept rising, yet the average stocks that are included in the index aren't demonstrating the same strength.
As the index is weighted by market capitalization, the largest companies in the pool have the biggest impact on the value. In the past two years, with the growth of AI, companies pivoting towards new technologies such as Nvidia or Apple can impact the index more than dozens of smaller S&P 500 companies in the opposite direction.
As of May 20th, the cap-weighted S&P 500 was up 8.6% for the year, while the S&P 500 equal weight index shows that the average of all companies was up only 6.8%. The Nasdaq gained 13.0%, and the Russell 2000 advanced 13.5%, signaling that a few companies drive growth. Not that small caps are underperforming.
Looking at the three-year gap, the divergence is the highest on record. Research data from RBC emphasizes that the cap-weighted S&P 500 has outperformed its equal weight counterpart by 32% over the past three years. It outperformed the peak from the late tech bubble of 31%.
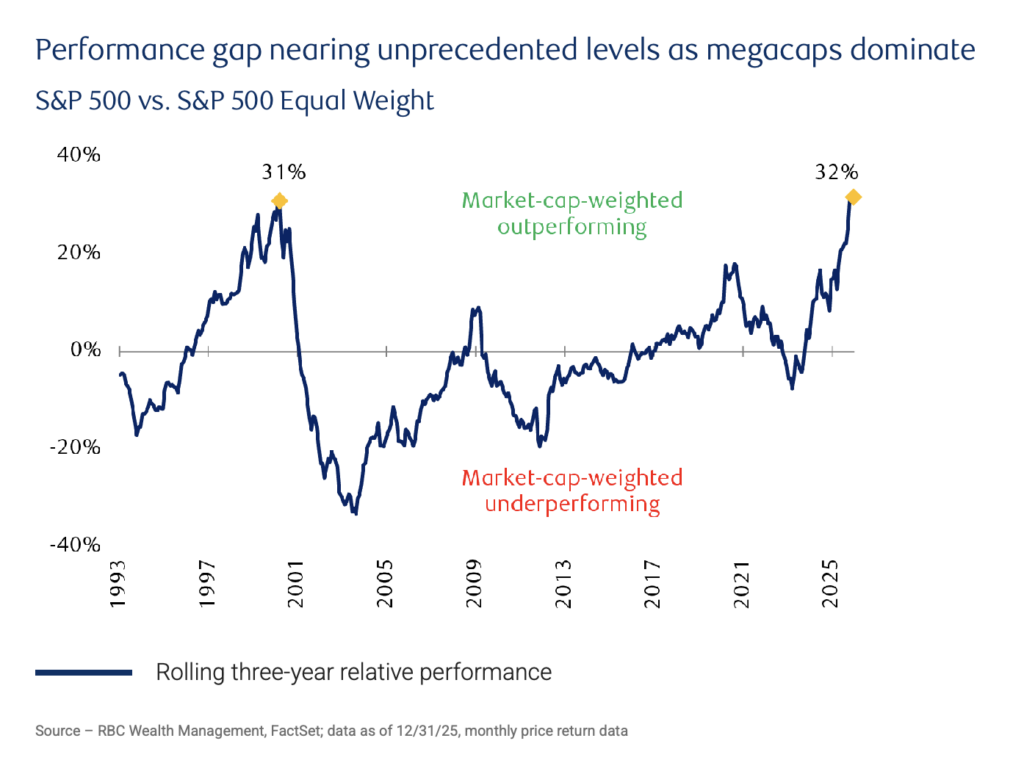
Economically, ETFs are designed to offer exposure to a diversified US stock market. However, the index's performance is now heavily reliant on a few mega-cap, AI-linked stocks that pull the entire market with them.
The top stocks carrying the index
The $SPY index shows the concentration directly. Four stocks—Nvidia, Apple, Microsoft, and Amazon—represent approximately 24.4% of the total index. Adding in Alphabet's two share classes, Broadcom, Meta, Tesla, and Berkshire Hathaway, the top 10 holdings represent 39% of the total index.
Research highlights that this concentration peaked at the end of 2023, when it doubled to reach 41%. A level of single-name concentration not seen in the US market for decades. The same data is observed across sectors. Technology accounts for 37% of the SPY.
What's interesting is that the S&P isn't concentrated by a company. Instead, it's concentrated by an entire sector that drives innovation. While in the 1990s it was around the internet and the WWW bubble, in 2024, it's about scaling AI: infrastructure, cloud computing, semiconductors, and mega-cap platforms.
In many cases, the fundamentals support the weighting. However, for the broader market as well as for investors, the challenge is that the index depends on the continued strength of a small cohort of companies. When growth slows down, the S&P 500 could correct strongly.
Earnings growth is concentrated too
Concentration diverts further from price-momentum dynamics and is driven by perceived growth. While growth is attributed to ROIC as it shows how tech is evolving, there's growing concern about investment spending circulating within members of the same group. Thus growth could be self-reinforcing with no real demand.
Analysis emphasizes that Q1 earnings growth for the S&P 500 is at 27.7%, the highest YoY growth since Q1 2021. It's the 6th consecutive quarter of double-digit growth, with no major correction between quarters. Moreover, 10 of the 11 sectors have experienced growth.
The key consideration is how much of that growth originates from how few names. In May, Alphabet, Amazon and Meta alone accounted for 71% of the net dollar-level increase in S&P 500 earnings. Among the list, four of the five contributors to year-over-year growth were Magnificent 7 companies (Alphabet, Nvidia, Amazon, Meta).
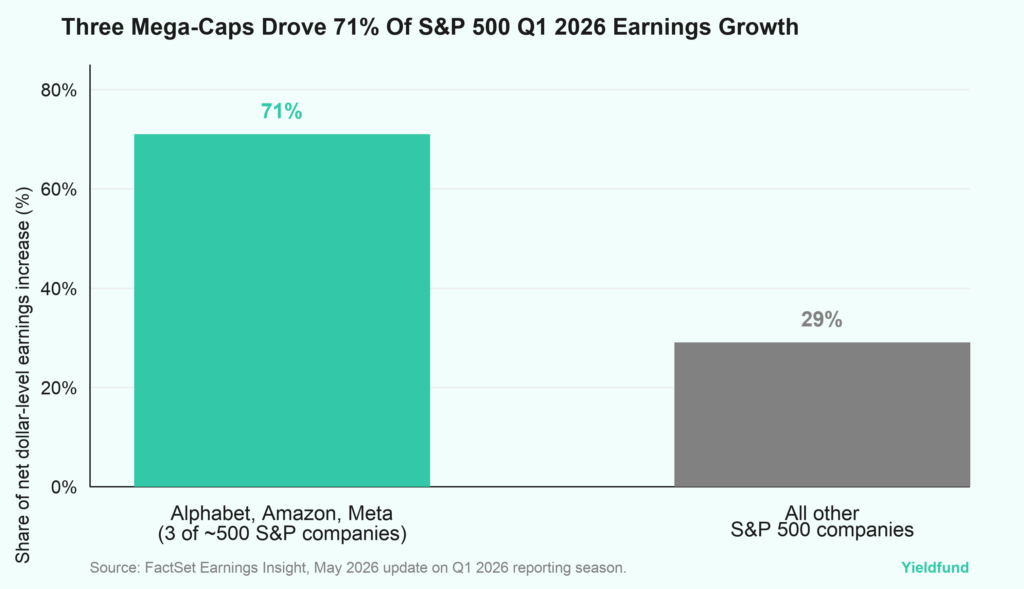
This explains why investors continue rewarding the largest names. They are not just large by historical accident as they are generating a disproportionate share of current earnings growth.
What market breadth is revealing beneath the surface
Market breadth measures how many stocks are actually participating in a rally. Currently, it is signaling a warning.
Data supports the evidence that "the rest of the market is falling." That's because during S&P 500 near record highs, only 45% of S&P 500 constituents were trading above their 50-day moving averages. It does not mean every stock outside the top four is declining.
Equal-weight is still up 6.8% YTD but does indicate that participation is unusually narrow for an index sitting at record highs. Strong bull markets typically broaden over time: more sectors participate, more stocks achieve new highs, and equal-weighted indexes confirm the move. When the S&P 500 continues rising while fewer stocks participate, the rally becomes structurally more vulnerable.
How the market should view the imbalance
The risk isn't that major tech stocks become overvalued; instead, the risk becomes that the S&P 500 is more dependent on them. For any investor, this changes how the index has to be viewed and interpreted. Many long-term strategies saw SPY as foundational. Now it no longer guarantees broad participation across the entire US market.
From the current analysis, there are three elements we have to understand.
Equal-weighted indexes are now becoming the most valuable diagnostic tool. The gap between the two indexes currently provides one of the clearest measures of how concentrated leadership has become.
Secondly, sector rotation becomes more important than ever. That's because if leadership is narrow, the market can continue rising. However, what's more important is for earnings strength to spread into mega-caps across other sectors, not be concentrated into a single one.
Finally, investors should distinguish between index performance and portfolio diversification. Owning the S&P 500 is not equivalent to owning an evenly balanced representation of the US stock market. In 2026, it means owning substantial AI and mega-cap technology exposure wrapped within a broad-market label.
The fact that the S&P 500 has more AI-driven stocks requires careful interpretation and a different strategy. The top names remain powerful enough to drive the index higher, and their earnings still justify much of the weighting.
For the second half of 2026, the question remains whether the rest of the market can catch up or will concentration increase further. If you are a regular trader who doesn't want to worry about the complexities of the stock market or the crypto market, Yieldfund offers structured investment plans with up to 48% yearly returns depending on the chosen plan and weekly payouts in USDC.
About the authors

Written by
Vlad Hategan
SEO content writer
Writes the articles in the Yieldfund knowledge base.
Dutch, English, Romanian

Translated by
Patricia Van den Kerckhove
Senior content translator
Translates and reviews Yieldfund's content in Dutch.
Dutch (NL & BE), French, English