Market conditions are shifting beneath the surface, and there are reasons to believe the market has reached its top. While hopium is in the air among traders who still expect a blow-off top altcoin season, recent data shows a contrarian belief: we’re noticing a market slowdown, investor confidence shifting, and other on-chain signals.
Even though Bitcoin reached heights above $126,000 and institutional adoption continues to grow, data suggest a market cycle shift and a potential end to the bull market.
As we’ve already been accustomed to, market downturns are rarely announced; however, they do leave evidence in liquidity, volume, risk appetite, and more. From macroeconomic headwinds and mass liquidations to on-chain data anomalies, we’re seeing a shift unfolding across multiple dimensions.
As we get closer to the end of the four-year market cycle, we see fit to define expectations and present concrete data on how we see the next couple of months unfolding—and why!
The macro events for a bear market
Market reversals are often overlooked simply because risk is misappropriated and attributed to ongoing events. They often form a directional bias even as some assets and positions reach concerning levels.
Geopolitical instability in 2025 was evident early on. President Trump’s tariff discussions were a major driver of volatility. The S&P 500 experienced its highest volatility in over a decade, jumping 9.5% after Trump announced tariff easing. A similar situation occurred in October, though the S&P 500 showed a milder response.
Simultaneously, Bitcoin and the broader crypto market experienced record liquidations. Recent tariff discussions triggered liquidations totaling up to $19 billion. While many attribute liquidations and market drawdowns primarily to news events, the underlying reality is more complex: market makers often withdraw liquidity, and institutional investors frequently sell Bitcoin before such crashes occur.
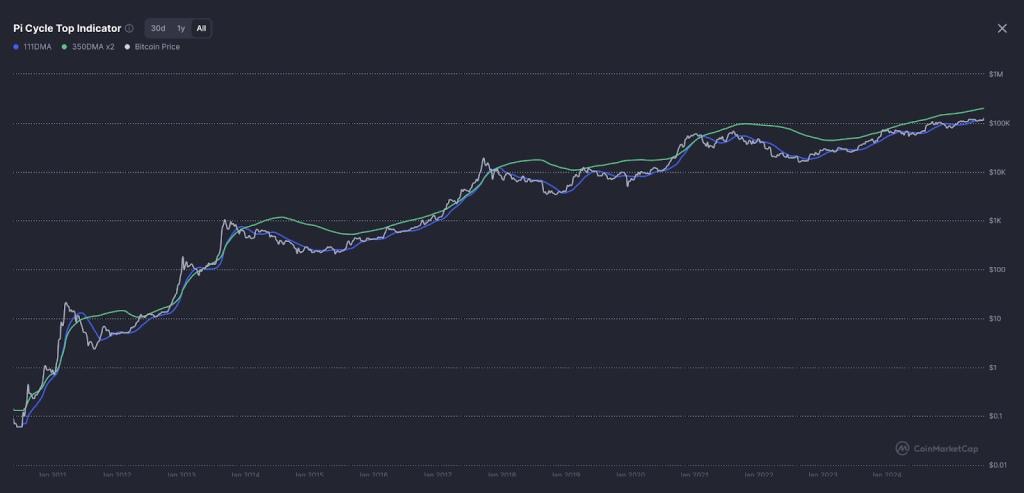
With that, the expectation of an altcoin season in which major cryptocurrencies trade at all-time highs starkly contradicts it. On-chain data suggests the Bitcoin bull market could be entering its final stages. According to Cycle Peak Countdown data, the current cycle is 99.3% complete with a statistical end date on October 24th.
What’s interesting to see is that the market’s retail consensus reaches peak optimism exactly at the market top. This means there is a stark disconnect between retail and institutional expectations—exactly what was seen during October’s liquidation event.
On-chain data also shows that we are currently 543 days post-halving. In previous bull runs, market tops have occurred between 518 and 580 days after halving.
5th Elliott Wave run
The Elliott Wave patterns are a strong indicator of market movements. The patterns show five waves, with the last one signaling a potential top before entering a reversal phase.
Taking a bird’s-eye view of the market structure, we could be nearing the completion of the 5th wave, which, in the case of Bitcoin, could signal a local top. While the current wave pattern is simply a prediction, Jesse Simons, CTO of Yieldfund, notes that a correction below $100,000 in the next couple of weeks could provide confirmation of this downward bias. He provides a further description of the current market sentiment in his recent LinkedIn post.
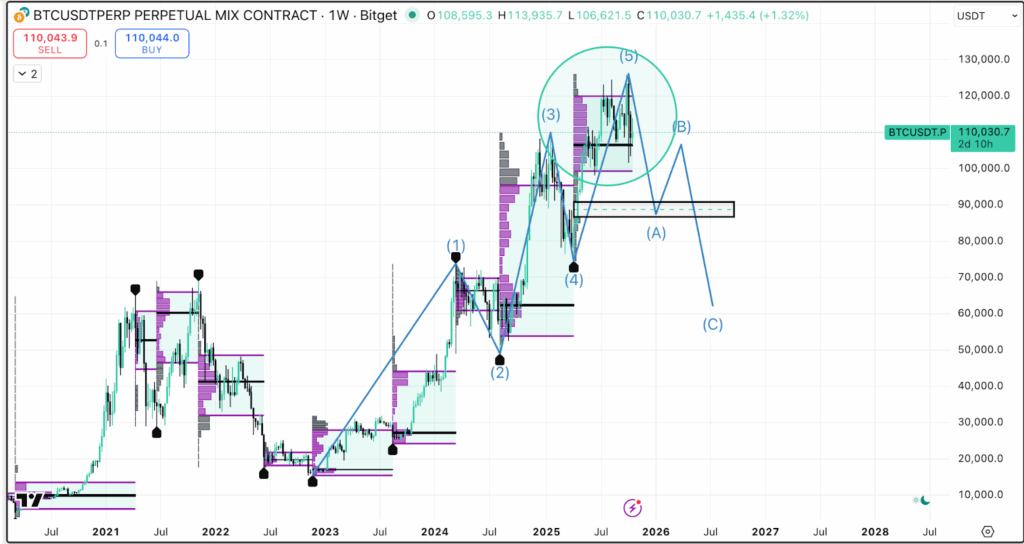
As shown in the current analysis, the market could have reached its peak at $126,000. Moreover, we aren’t seeing any additional momentum from Bitcoin, and the market as BTC dominance remains trapped near 59.7%, oscillating between 58% support and 60-61% resistance.
As a whole, the current market could be cooling off. The assumption is also reflected in ETF and institutional behavior. BTC ETF flows recently flipped from massive $627 million inflows to $5.5 million outflows. The shift shows growing interest in profit-taking, as institutional investors may be preparing for a structural shift.
Key on-chain metrics support this bearish thesis. The Net Unrealized Profit/Loss (NUPL) indicator has dropped to 0.522, while the Market Value to Realized Value (MVRV) ratio fell to 2.15. These metrics often signal when markets become overextended and due for correction.
Net volume and point of control
Weekly charts provide an outlook on how volume is distributed in demand zones. The following chart, if overlapped with the five-wave theory, shows a potential imbalance.
If we were to break the Point of Control (POC) in the last volume area in Wave 5, and flip the POC area into resistance, we are likely to correct the imbalance area. The area is marked in grey and shows where the least amount of volume is for the current volume range.
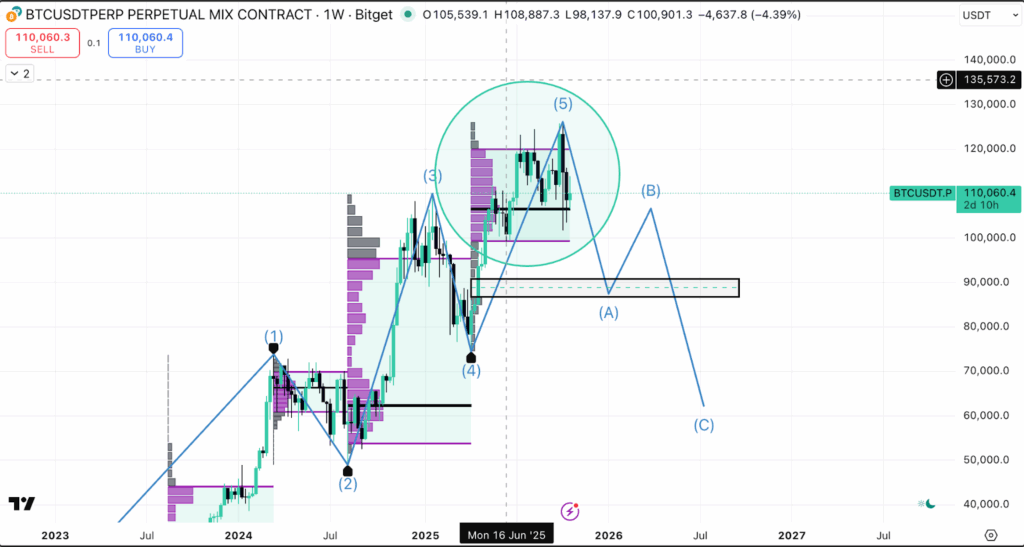
When comparing the last impulses, wave 5 has a weaker % increase than past impulses. This is due to demand decreasing as BTC prices are seen as too inflated for retail and institutions to continue to accumulate.
Additionally, if the prices reach the level and buyers enter the space at a “reasonable” price, then the next upswing could be rejected again at the net POC of $106.500. The move will provide confirmation of a higher-time-frame lower high.
As such, if the new low is broken on the weekly time frame, and the support turns into resistance, then it’s safe to assume we are entering a new “bear market”.
The NVT and MVRV ratios for market valuation
Network Value to Transactions (NVT) and Market Value to Realized Value (MVRV) ratios provide sophisticated tools for assessing cryptocurrency valuations relative to network activity and holder behavior.
The NVT ratio currently suggests Bitcoin is overvalued relative to its transaction volume, similar to patterns observed before previous bear markets. When network value significantly exceeds transaction utility, it often indicates speculative excess that eventually corrects.
MVRV ratios have declined from extreme levels but remain elevated by historical standards. At 2.15, the current MVRV suggests the average Bitcoin holder sits on substantial unrealized profits—a condition that often precedes distribution phases as holders take profits.
These valuation metrics become particularly important when cross-referenced with price action and market sentiment. High valuations can persist during strong bull markets, but they become vulnerable when other supporting factors deteriorate.
Historically, this shows that sustained periods of elevated NVT and MVRV ratios typically resolve through either significant price corrections or substantial increases in network activity. Current trends suggest the former may be more likely than the latter.
Gold and silver over-valuation
Both gold and silver have reached new all-time highs as investors view the commodities as a store of value amid growing market uncertainty. Google searches for “how to buy gold” have reached 100, while gold ETFs topped $35 billion through September 2025.
However, analysts emphasize that gold is entering a “bubble zone”. An economist at Capital Economics highlights the bubble factor and predicts gold to be priced at $3,500 by the end of 2026, as FOMO and impulse buying have created favorable conditions for institutions to sell the top.
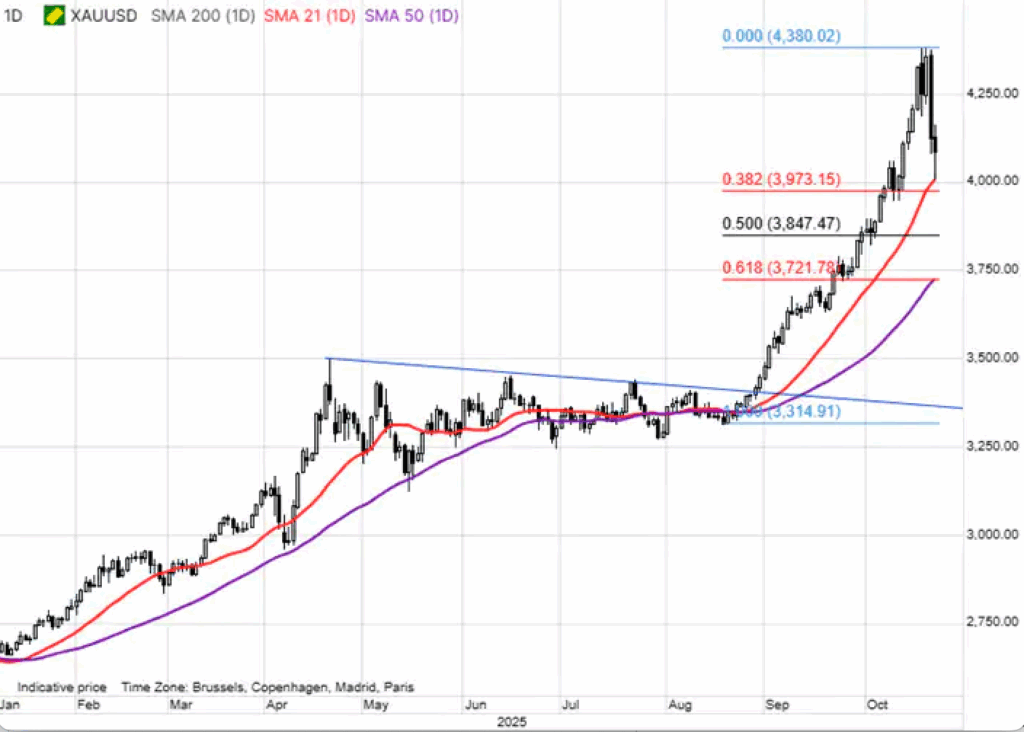
Year-to-date, gold has increased by 56% topping at $4,398 per ounce; however, with the sharp increase comes a sharper correction. Gold futures have shrunk 5.7% in less than a day and another 1.1% in the next.
Analysts do emphasize that a correction “is healthy,” however, this shows what we’ve also highlighted in crypto. Prices are currently overbought, driven by extreme greed, even though the market is less cash flow positive than it should be to see such price movements.
The parabolic increase in gold and silver, while unsustainable, reflects an extended rally. Geopolitical sentiment has made traders increasingly cautious, leading them to focus on protecting their gains.
Earnings recession as a double threat
Corporate earnings growth shows signs of deceleration across multiple sectors, creating headwinds for risk assets that rely on continued economic expansion. When earnings contract while valuations remain elevated, the result is often swift and severe multiple compression.
The cryptocurrency sector faces unique challenges in this environment. Many crypto companies that went public during the previous bull market now trade at significant premiums to traditional tech stocks, despite facing greater regulatory uncertainty and operational challenges.
Multiple compression occurs when investors become less willing to pay premium prices for growth assets. This process can accelerate quickly once it begins, as momentum investors who drove prices higher during the bull run often become sellers when trends reverse.
The threat becomes more pronounced when considering that many crypto-adjacent stocks and funds have yet to reflect the full impact of regulatory scrutiny and changing market conditions. As earnings expectations reset lower, the adjustment period could prove particularly painful for overvalued assets.
Are we heading for a bear market?
The current scenario and some data suggest a potential market reset. Structural issues in the crypto market, market-maker manipulation, and record liquidations that flush out open interest could be seen as strong catalysts.
Additionally, the current rate cuts could cancel the bear market if we are indeed in the fifth wave. What’s worth noting is that the previous rate cut in September, expected to push Bitcoin past its previous all-time high, failed to do so. Bitcoin ranged between $115,000 and $117,000 while the S&P 500 dipped following the announcement.
Other rate cuts are expected in October; however, analysts emphasize the fact that they might already be priced in. With that, the question remains whether we’ll see an increase in new-market liquidity or whether investors—both retail and institutional—will view the current prices as too high a premium.
If demand for Bitcoin and other digital assets continues to drop, a weekly lower high formation could play out. While we can’t predict what’s going to happen in the future, current on-chain data and investor behavior do point to a weakening Bitcoin market.


