Bitcoin recently experienced a sharp downturn, followed by a swift recovery that pushed the price above $90,000, leaving many investors wondering what this V-shaped pattern signifies. After dipping to a low of $82,000 for the first time in a couple of months, the world’s largest cryptocurrency bounced back, climbing above the $90,000 mark.
Is Bitcoin’s recent bounce a sign of market resilience or simply a temporary relief rally in a potential longer downturn? Let’s unpack everything in this post and understand the factors.
Unpacking Bitcoin’s sudden decline
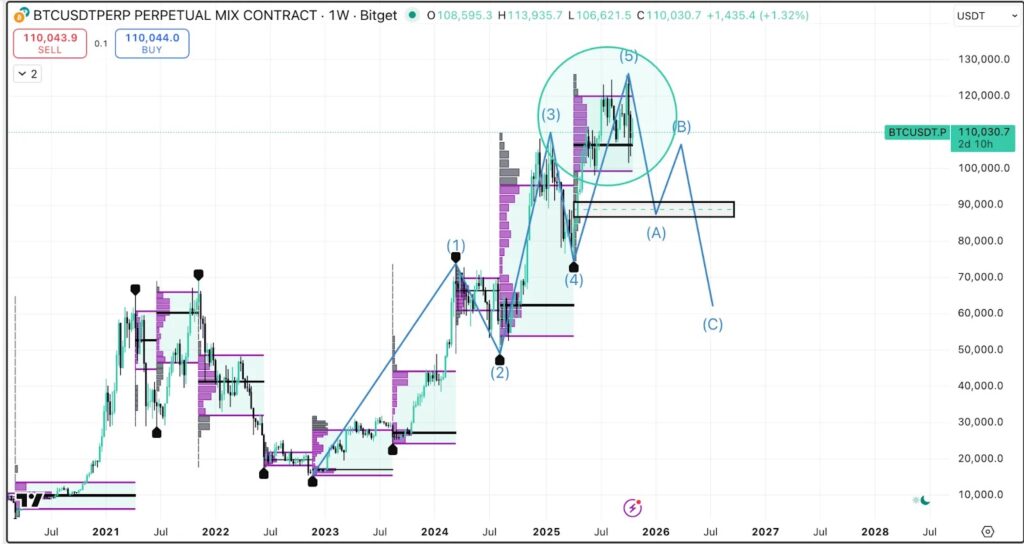
Bitcoin’s recent price drop to its lowest level since April was influenced by a mix of macroeconomic pressures and market-specific events. We first emphasized the potential for an upcoming bear market, driven by several factors, including lower demand at higher premiums and the completion of the 5th Elliott wave. Another factor is the uncertainty surrounding U.S. fiscal policy.
With the U.S. government shutdown in late 2025, liquidity has frozen, and economic data has been delayed. As a result, investors were forced to pull back from riskier investments, even as the Fed continued to cut interest rates. Unfortunately, the outcomes weren’t as expected, and markets didn’t react as investors wanted. Yet the S&P 500 continued to post higher gains.
Furthermore, persistent inflation and shifting expectations around Federal Reserve rate cuts contributed to the volatility. While the market initially priced in rate cuts, waning optimism led to a repricing of risk assets, and Bitcoin’s valuation declined. This period also saw significant institutional leverage and events such as the $19 billion mass liquidation, which amplified price swings and led to record liquidations as Bitcoin’s price fell.
The bounce-back drivers
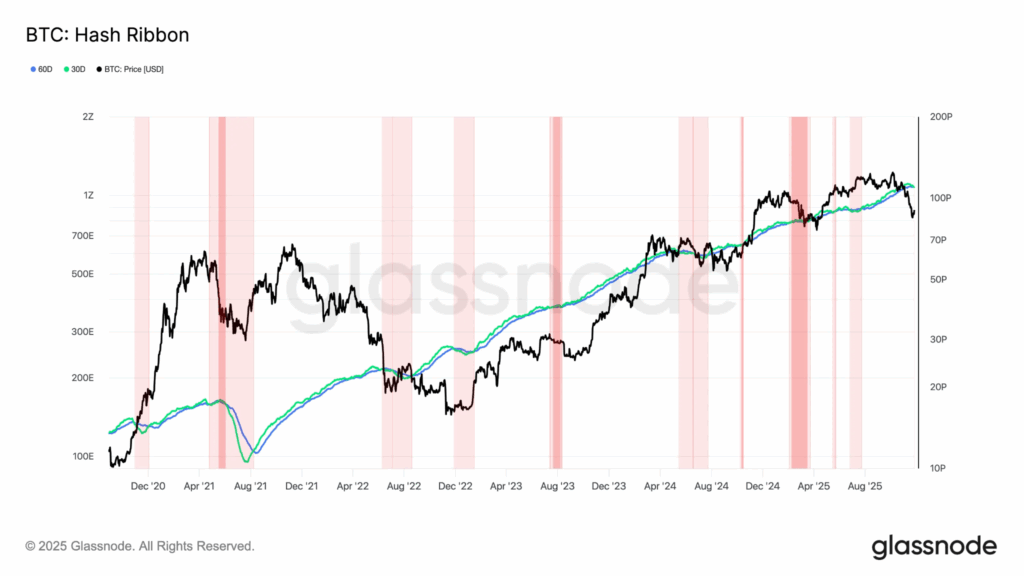
Even as Bitcoin dropped to new lows, the decline was followed by a price recovery. Renewed optimism about potential Fed rate cuts reignited investor confidence. Additionally, the Hash Ribbon indicator, a historically reliable tool for identifying market bottoms, flashed a buy signal, suggesting that miner capitulation had occurred. This entails less efficient miners selling off their holdings, and historically, this phase has preceded strong upward movements.
On-chain data provided further bullish signals. Bitcoin whales with holdings of 10,000 BTC or more began accumulating and repurchasing BTC into the market for the first time since August. As a result, Bitcoin’s price has climbed back above key technical levels, including its 200-week moving average (200WMA) at $54,000, which is often seen as an indicator of a reversal of a strong upward movement. The recovery from $81,000 to over $90,000 was sharp, fueled by this combination of technical signals and a more positive market sentiment.
What this means for investors
For investors, this V-shaped recovery presents a complex picture. On the one hand, the strong bounce from a key support level ($81,000-$82,000) and positive on-chain metrics suggest underlying market strength. Buyers returning to the markets and a strong signal such as the Hash Ribbon could indicate that there is a potential bottom – at least in a short-term window. Moreover, this highlights that the sell-off could be over and investors could look for new opportunities.
However, caution is still warranted. Some analysts warn that such sharp relief rallies can occur in any market and are often followed by additional selling pressure. The market’s heavy reliance on Fed policy means that any unexpected hawkish signals could quickly reverse the recent gains. Key resistance levels to watch are between $92,000 and $95,000, and a failure to break through could signal a consolidation phase or another dip.
Looking ahead in 2025
As we move forward, the interplay between macroeconomic factors and technical indicators will be crucial. The Federal Reserve’s decisions on interest rates will remain a primary driver of market sentiment. If the Fed proceeds with rate cuts and liquidity improves, Bitcoin could be positioned for a sustained rally toward previous highs.
Investors should closely monitor key support and resistance levels. The ability of Bitcoin to hold above the $82,000–$85,000 support zone was critical, and a potential break above the $95,000 resistance could pave the way for a move toward $100,000. Conversely, a drop below these support levels could signal a deeper correction. A diversified approach, balancing long-term belief in Bitcoin’s potential with strategies to hedge against short-term volatility, remains the most prudent path.
The path to smart investing
Bitcoin’s recent price action highlights both its inherent volatility and its potential for rapid recovery. While the V-shaped bounce is encouraging, it’s essential for investors to remain analytical and avoid making decisions based on short-term market sentiment.
For traders who want to invest in the crypto market without understanding or being exposed to Bitcoin’s volatility, Yieldfund offers three investment plans with annual returns of up to 48% and weekly payouts in USDC.