

The S&P 500 can be at all-time highs while crypto still waits for confirmation. That gap matters because capital rotation does not happen all at once. It usually starts in the deepest, most liquid markets, then moves further out on the risk curve only when liquidity, confidence, and narrative align.
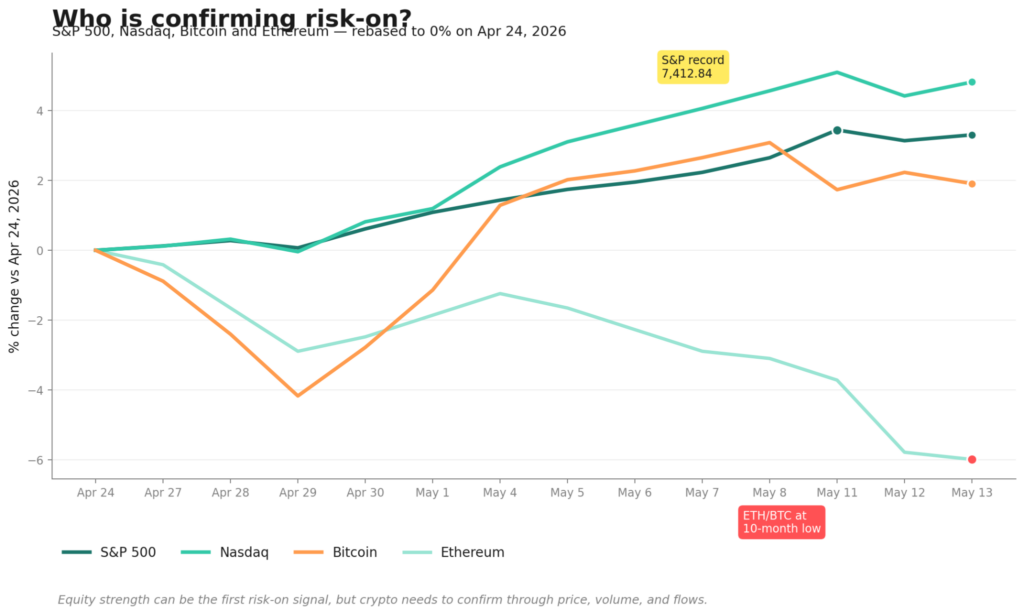
That is the tension in markets right now. The S&P 500 closed at a record 7,412.84 on May 11, 2026, the Nasdaq Composite printed its own record at 26,247.08 the same week, and Bitcoin spot ETFs just posted their sixth straight week of inflows, adding roughly $3.4 billion since early April. Bitcoin reclaimed $80,000 for the first time since January. On the surface, the cascade thesis is working.
Underneath, the picture is more uneven. The honest read is that this is a thesis test, not a thesis confirmation. Equity strength is the first signal of risk appetite, not the last one.
The contradiction: equities are at highs, but crypto has not fully confirmed
Look at the last three weeks side by side, and the divergence is structural, not noise.
Between April 24 and May 11, the S&P 500 moved from 7,165 to 7,412 — roughly +3.4% — and made multiple closing records along the way. The Nasdaq Composite gained +4.51% in the single week of May 4–8 to close at a record 26,247. Bitcoin, in the same window, moved from roughly $79,100 to $81,540 and is now back near $79,500. That is a flat-to-marginal move on a percentage basis that lagged the index it is supposed to be a higher-beta version of.
Ethereum is worse. ETH traded around $2,330 on May 11 and slipped to $2,258 by May 14. On a relative basis, that has pulled ETH/BTC to a 10-month low.
So the cascade thesis has a problem at the second checkpoint. Equity strength is broadcasting risk-on. Bitcoin is partially confirmed through ETF flows. But Ethereum, the asset most sensitive to actual liquidity, is making a relative new low. That is not what a confirmed cross-asset rotation looks like. That is what it looks like when institutional money is buying the safest expression of crypto exposure and stopping there.
Why capital usually moves first into liquid TradFi assets
This sequence is not random. It is a function of how institutional portfolios are actually built.
When risk appetite returns, the first dollars flow into the deepest, most regulated, most benchmark-relevant markets. The S&P 500 absorbs allocation from 401(k) flows, target-date funds, pension rebalancing, and passive ETFs without moving the order book. Mega-cap tech inside the Nasdaq absorbs the next layer — concentrated bets that still satisfy mandate constraints. Both can be sized, hedged, and explained to a risk committee. Neither requires anyone to file a new compliance memo.
Crypto sits on the other side of that wall. Even with spot Bitcoin and Ether ETFs trading in the US, the asset class still requires explicit allocation decisions, separate risk frameworks, and, in many cases, approval at the IPS (investment policy statement) level. That friction means capital arrives later and unevenly. It also means that the first crypto buying that does show up tends to concentrate in the single most liquid, most familiar instrument — spot Bitcoin ETFs — before anything else.
This is why a stock-market record alone is never enough to confirm a crypto cycle. The plumbing routes confidence in a sequence: passive equity flows first, then concentrated tech exposure, then Bitcoin via ETF, then Ethereum, then large-cap alts, then narrative-driven beta. Each step requires the prior one to hold for long enough that allocators feel comfortable moving further out.
We are clearly past step one. We are partway through step three. Steps four through six have not started.
What the S&P 500 and Nasdaq rally are really telling us
The equity move itself is real, but it is narrower than the headline numbers suggest.
The Magnificent Seven cohort continues to do most of the index-level work. On May 13, Nvidia rallied roughly 2.5% pre-market on news that CEO Jensen Huang would join President Trump's Beijing summit. Chipmakers, including Qualcomm, Intel, and Micron, resumed their rally on the same headlines. This is concentration leadership: a small group of mega-cap names driving a cap-weighted index to records while the median stock contributes less.
The S&P 500 Equal Weight Index — the cleanest read on whether the average stock is participating — sat at 7,624.61 at the end of March. The cap-weighted index has outpaced that benchmark on net over the spring, meaning the rally is being carried by the top of the curve, not the middle. Goldman Sachs Asset Management is publicly skeptical that Magnificent Seven dominance can persist much longer , and Warren Buffett used the May 11 Berkshire annual meeting to call out what he described as a gambling mood in current markets.
This matters for the cascade thesis. A narrow rally can still produce all-time highs. It produces a weaker foundation for cross-asset rotation because the breadth required to feed liquidity into smaller, higher-beta corners — including crypto — is not yet there. Risk appetite expressed only through Nvidia and a handful of hyperscalers is not the same risk appetite that funds altcoin breadth.
Volatility tells the same story, just quietly. The VIX has stayed in the mid-teens through the recent ATH run, consistent with index-level calm but not with the kind of broad-based euphoria that historically precedes capital rotation deep into the risk curve.
Why the macro backdrop still matters
The single most underweighted variable in current narrative-driven analysis is what bond yields and the dollar are actually doing.
The 10-year Treasury yield closed at 4.46% on May 12, up from 4.36% on May 6. The Dollar Index sat at 98.29 on May 12 and ticked up to 98.55 on May 13 . Neither move is dramatic, but both push in the wrong direction for the cascade thesis. Higher real yields raise the opportunity cost of holding non-yielding assets. A firmer dollar tightens global liquidity at the margin.
The April CPI report released on May 12 made the picture harder. Headline inflation came in at 3.8% year-over-year, the highest reading since May 2023, with core CPI at 2.8% — both running above consensus expectations. The Federal Reserve held the federal funds rate steady at 3.50%–3.75% at its April 29 meeting. Bank of America Global Research now expects no further cuts in 2026, with two quarter-point reductions pushed out to July and September 2027. J.P. Morgan reached the same conclusion in April: hold through year-end.
The simple version: inflation is sticky, the Fed is on hold, real yields are not coming down, and the dollar is not weakening. That is a backdrop where equities can climb because earnings are still growing and AI capex is still expanding. It is a much harder backdrop for capital to migrate further out on the risk curve, because the marginal incentive to leave Treasuries for higher-beta assets is muted when Treasuries still pay over 4%.
Crypto historically performs best when the opposite is true: yields falling, dollar weakening, real-rate impulses easing. None of those conditions are firmly in place right now.
What Bitcoin, Ethereum, and ETF flows are saying
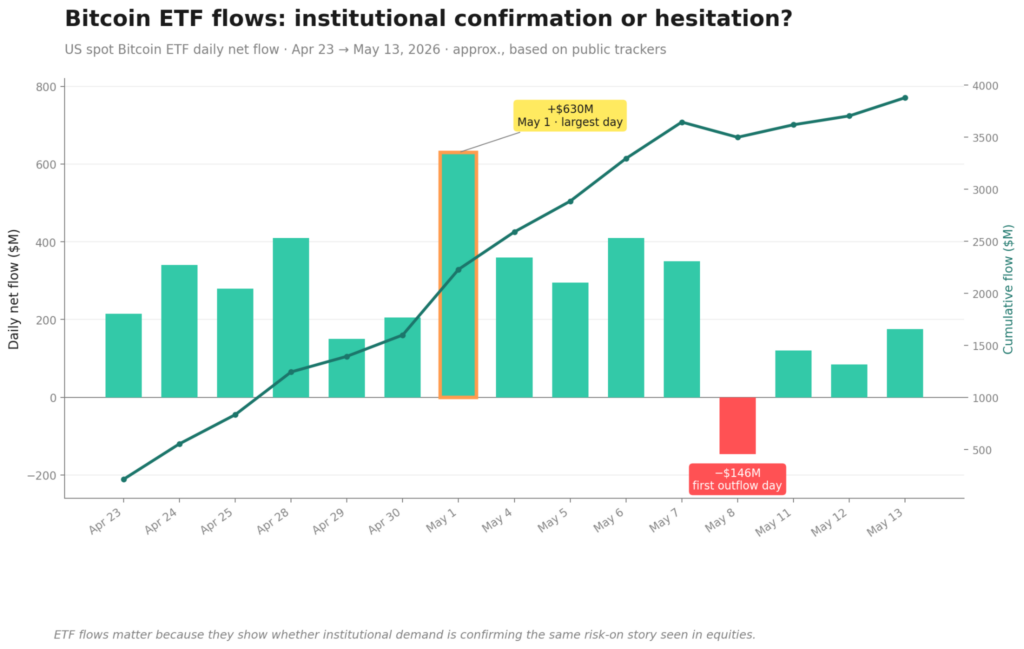
In April, US spot Bitcoin ETFs pulled in $1.97 billion, the largest monthly inflow of 2026. The streak extended into May: one weekly tracker recorded $996 million of net inflows in a single week, and a five-day inflow run approached $1.7 billion. The cumulative figure across six straight weekly inflows is roughly $3.4 billion. That is institutional demand showing up consistently and at scale.
But the streak has cracks. May 8 marked the first negative day of the month for spot BTC ETFs at -$146 million Spot Ethereum ETFs had a -$104 million outflow on May 7 and another -$16.85 million outflow on May 11. The institutional flow is real, but it is concentrated in Bitcoin and fragile in Ethereum.
The price action is consistent with that pattern. Bitcoin broke $80,000 on May 4 for the first time since January and closed the week at $81,540, but has spent the following days probing the 200-day EMA at $82,228 from below without breaking through. By May 14, Bitcoin had drifted back to roughly $79,283. Bitcoin Open Interest registered its largest single-day increase of 2026 in early May, then unwound on May 12 with funding rates turning deeply negative. That is a leveraged push that did not get follow-through buying.
Ethereum is the cleaner failure. ETH closed May 11 at $2,330, dropped to $2,280 by mid-week, and sat at $2,258 on May 14. The ETH/BTC ratio is at a 10-month low. When ETH/BTC falls during a stretch where equity indices are printing records and BTC ETFs are taking in billions, it tells you risk appetite is not propagating past Bitcoin.
The liquidity base is supportive but not surging. Total stablecoin supply crossed $320 billion on April 16 and rose to $320.6 billion by early May. That is incremental growth from a high base — supportive, not igniting. Bitcoin dominance sits at 60.1% per Bitrue, and the Altcoin Season Index reads 35 out of 100. Total crypto market cap is around $2.74 trillion, barely moving as Bitcoin grinds. Altcoins are not getting bid.
What would confirm the next phase of crypto rotation
The setup is forming. Confirmation is incomplete. Here is what needs to fire for the cascade to extend.
Bitcoin is clearing the 200-day EMA on volume. Until BTC closes above $82,228 and holds — ideally with rising spot volume rather than perpetual-driven OI — the equity rally is not being technically validated in crypto. A failed retest with falling funding is the bearish version of this story.
ETF inflow consistency past the first outflow shock. The May 8 -$146 million day was a normal pause inside a strong streak. The test is whether the next outflow day stays small and isolated. A second or third consecutive outflow day would suggest institutional demand was front-loaded around the equity ATH and is now thinning.
Ethereum reclaiming relative strength. ETH/BTC at a 10-month low is the single cleanest signal that capital is not yet moving further out. A reversal in ETH/BTC, combined with positive ETH ETF flow days replacing the recent outflows, would be the first evidence that the rotation is extending past Bitcoin.
Stablecoin supply expansion is accelerating. Stablecoin supply is the closest proxy for dry powder inside crypto. Movement from $320 billion to $325 billion or higher in the next several weeks would be a meaningful liquidity signal. Stalling here would be evidence that new capital is not arriving.
Altcoin breadth. The Altcoin Season Index at 35 and Bitcoin dominance at 60.1% define the floor of altcoin season — not the start of one. A move in BTC.D below ~58% combined with a breakout in large-cap alts (SOL, XRP, BNB) and the first move in sector narratives (AI tokens, RWA, L2 ecosystems) would mark the actual rotation event.
A softer macro backdrop. Lower 10-year yields, a weaker dollar, and a CPI print closer to consensus would meaningfully reduce the opportunity cost of holding higher-beta assets. The May 12 CPI at 3.8% made this harder, not easier.
The usual sequence inside crypto is well documented: Bitcoin first, Ethereum second, large-cap alts third, high-beta narratives last. We are stuck between steps one and two.
Conclusion
The honest read on mid-May 2026 is that the equity rally is the first signal, not the final one. The S&P 500 and Nasdaq are at records. Bitcoin ETFs have pulled in $3.4 billion across six straight weekly inflows. Bitcoin itself reclaimed $80,000. Those are real confirmations of the front end of the cascade.
But Bitcoin is stalling under its 200-day EMA. Ethereum is making a relative ten-month low. Altcoins are quiet. Stablecoin supply is incremental, not surging. The 10-year sits near 4.46%, the dollar is firming, the April CPI came in hot, and the Fed is unlikely to cut in 2026. Each of those macro variables raises the cost of moving further out on the risk curve.
The framework, then, is simple. S&P 500 strength shows where confidence starts. Crypto price action and ETF flows show whether risk appetite is spreading. Ethereum and altcoin breadth show whether capital is actually rotating. Macro conditions show whether the rotation can extend.
Right now, three of those four are flashing only partial green. The setup is forming. The confirmation is incomplete. The next phase depends on whether liquidity moves further out on the risk curve — and on the data, which has not happened yet.